
scatter diagram
This type of diagram is used to find out if there is a relationship between the variables in a set of data.
The data is presented as pairs of values, and every pair is plotted as coordinates on a graph.
If there is a relationship between both sets, the points tend to lie on a straight line.
Let’s use the following as an example.
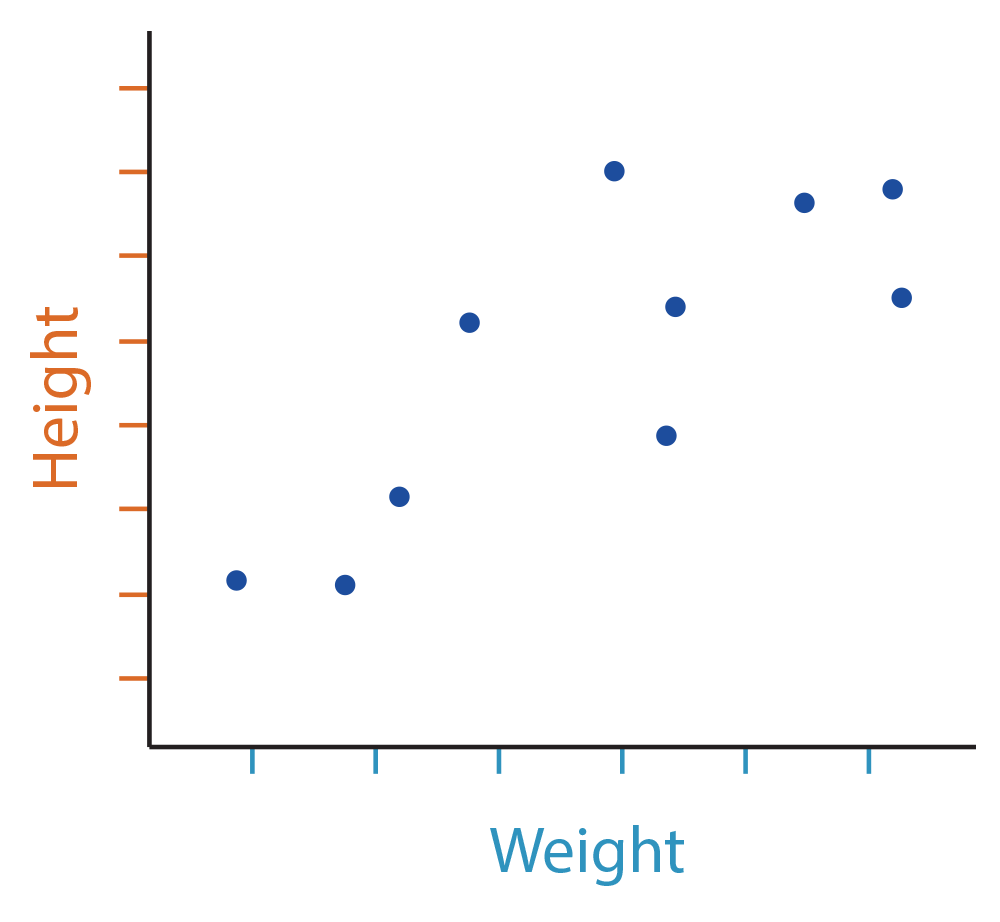
The height and weight of a group of people are measured, and the data is plotted on a graph. Each point on the diagram represents a person’s weight against their height.
Another name for a scatter diagram is scatter graph.