block graph
A block graph is a simple way of showing statistical information.
Blocks represent different sizes or numbers. One block usually represents one observation.
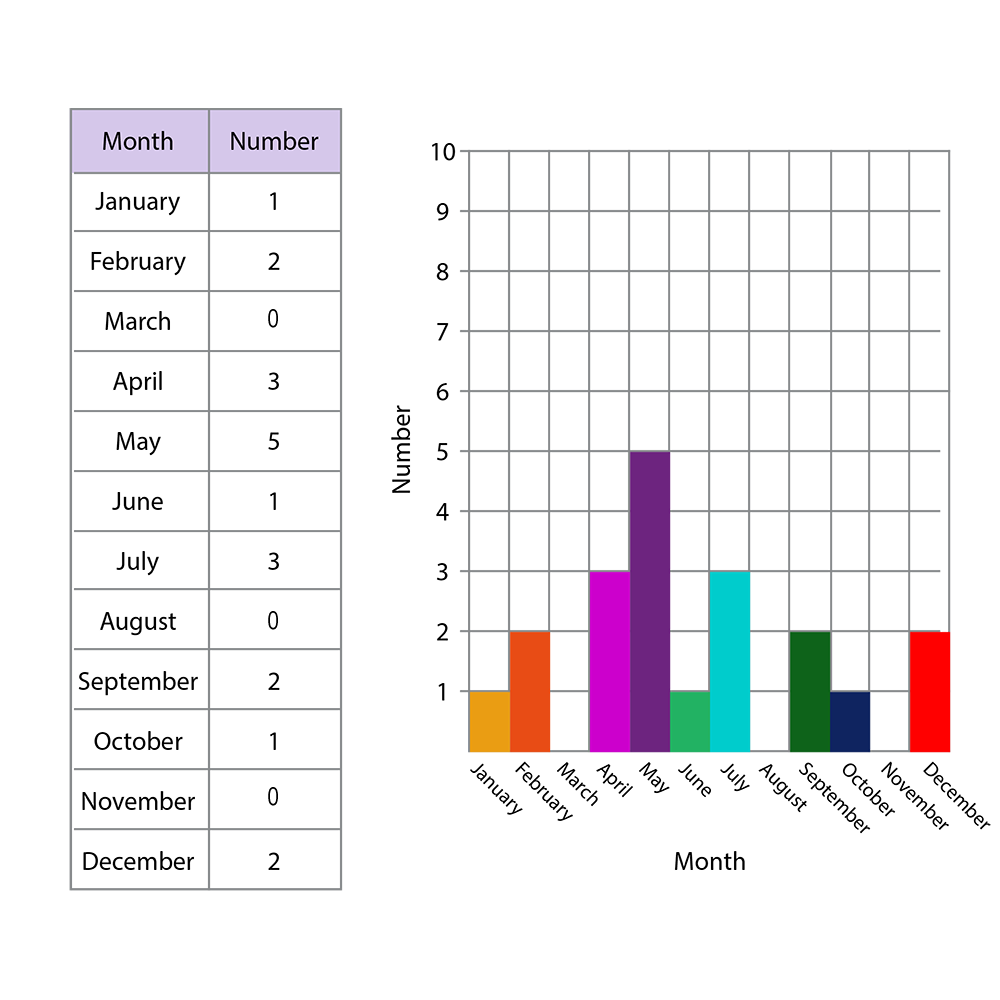
The table shows the month in which 20 children celebrate their birthday. The block graph represents this information.