
stem and leaf diagram
This type of diagram is used to show grouped data.
For example, year 8 pupils sit a mathematics examination which is marked out of 50.
Here are the results:
-
7, 50, 42, 11, 36, 13, 44, 22, 25, 14, 29, 34, 37, 29, 44, 9, 18, 17, 37, 46, 48, 19, 38, 5, 29, 50, 41, 28, 49, 17
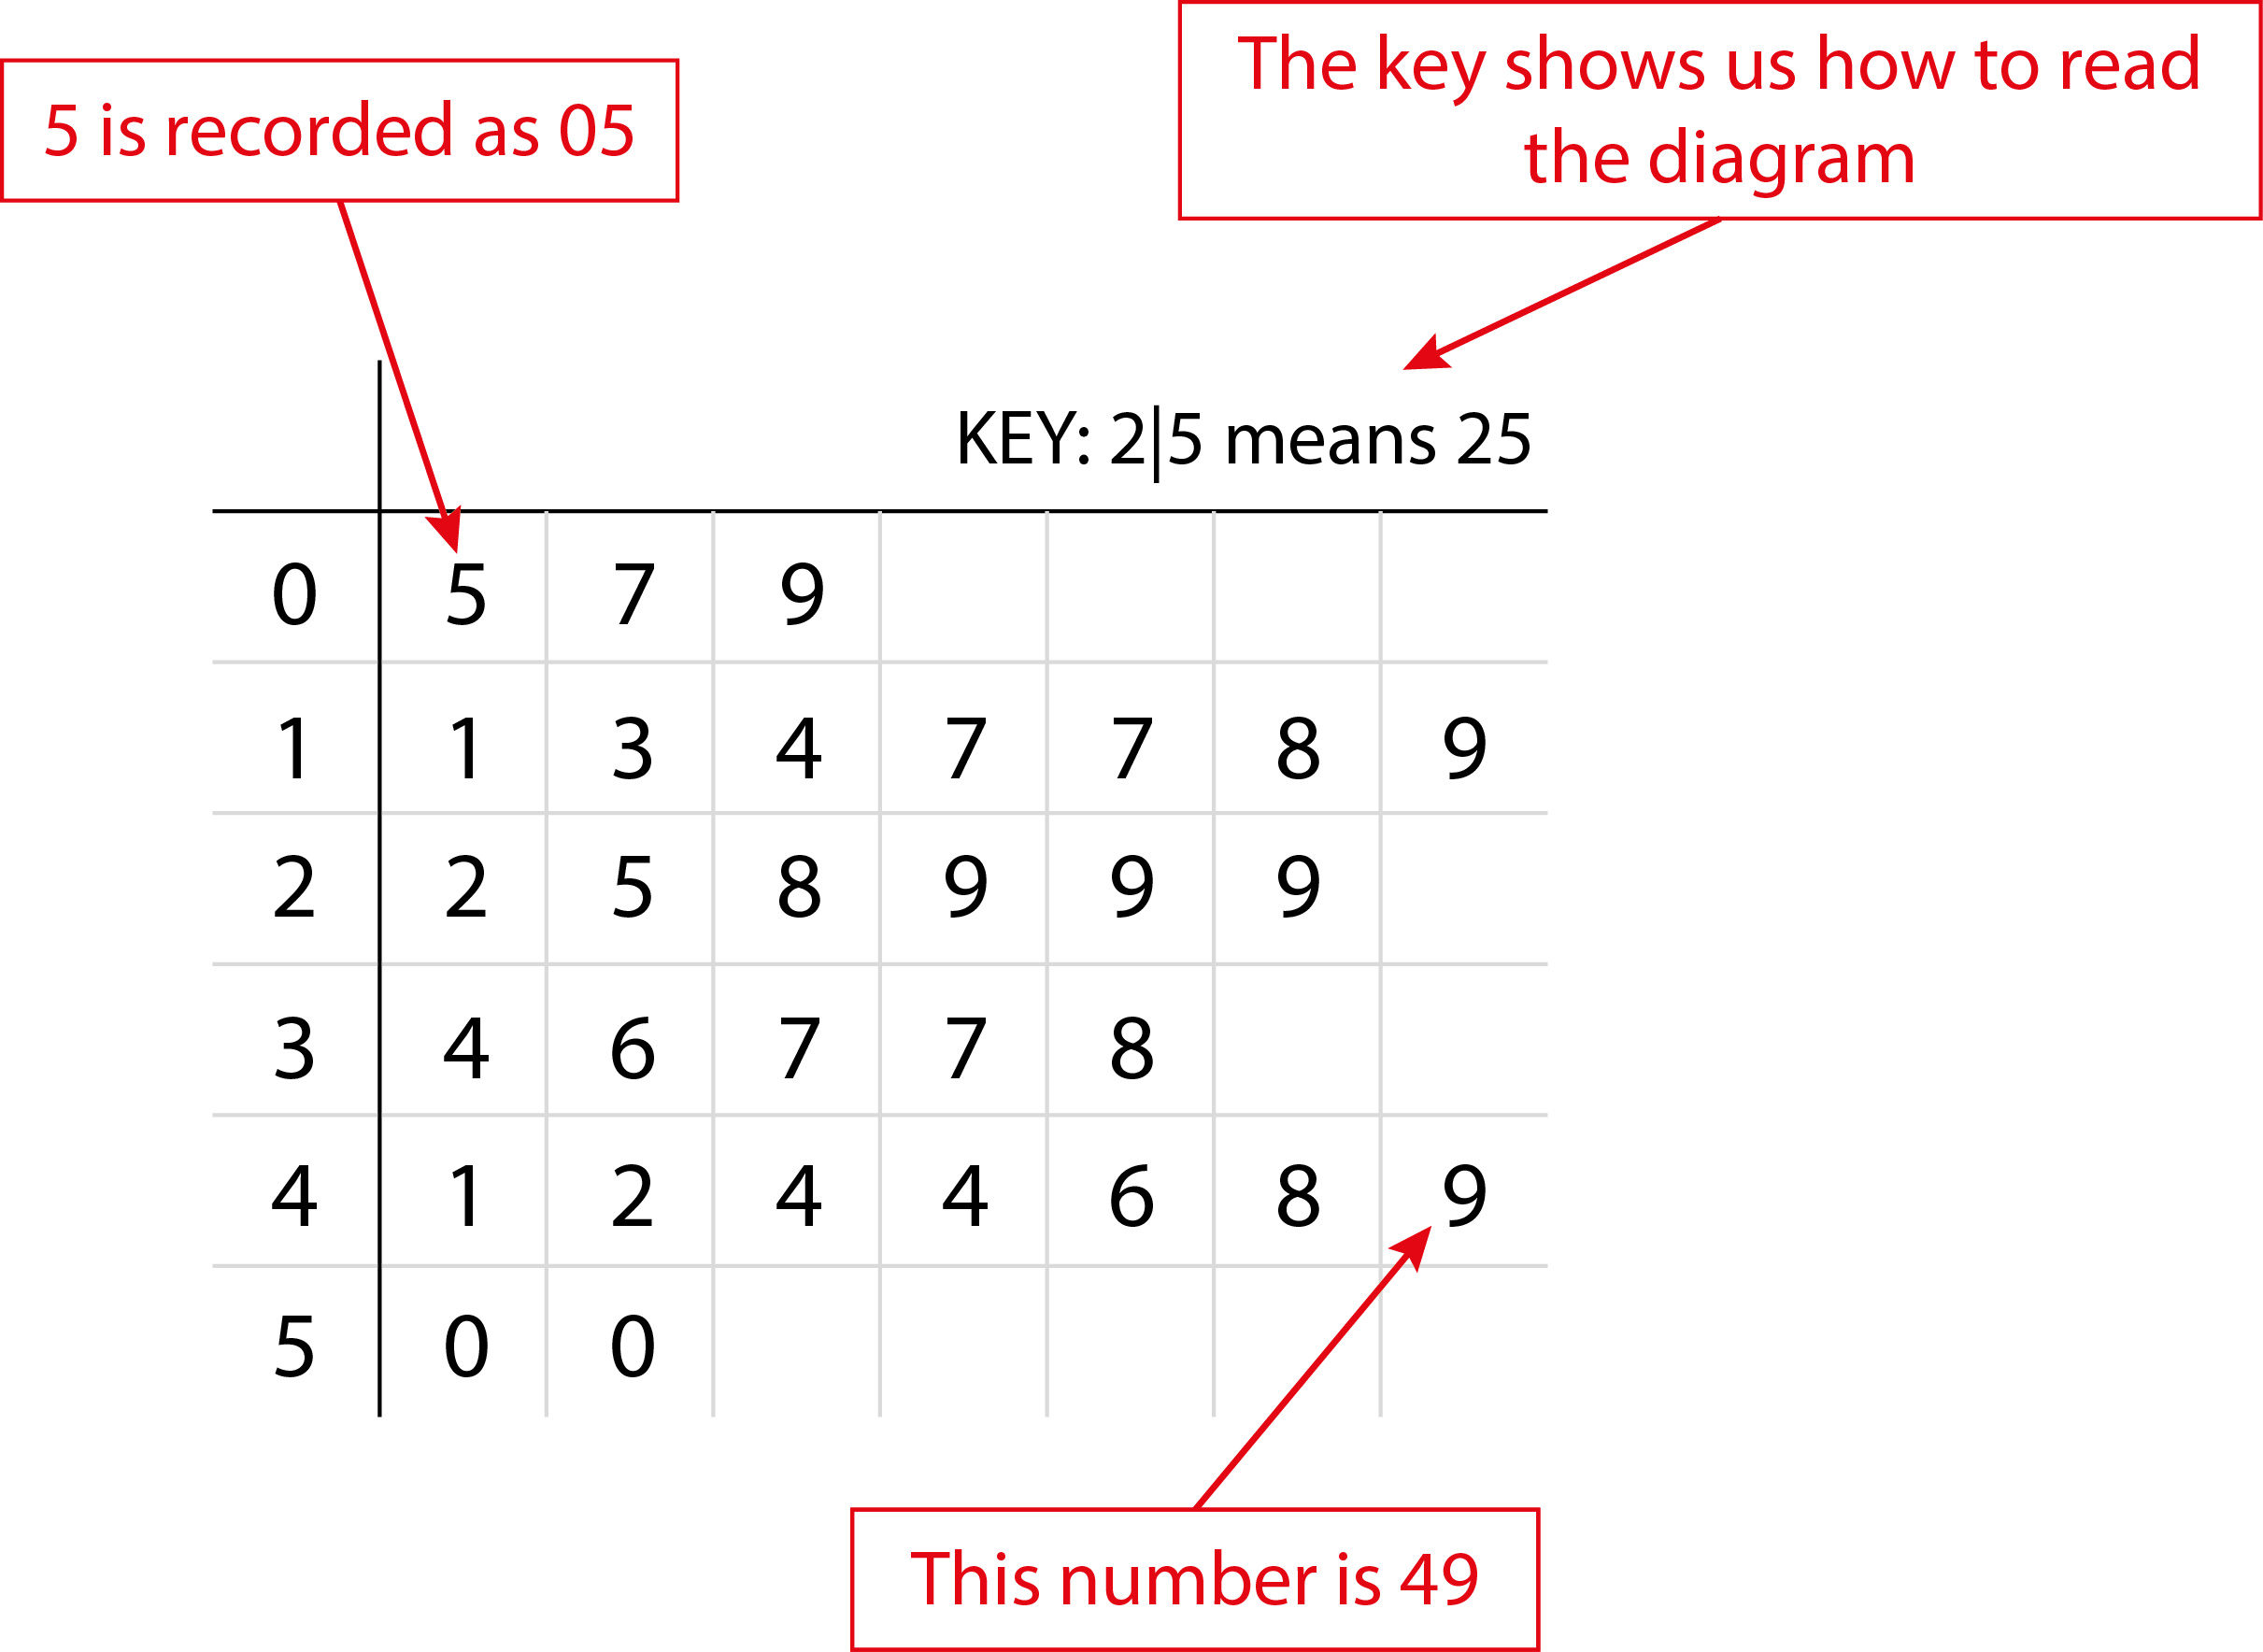
It is easier to interpret this data by showing it in the form of a stem and leaf diagram, as shown in the picture.
The numbers have been divided into tens and units.
The tens, which are the class intervals, form the stem. The units, which are the comments, are listed against the stem to form the leaves.
A stem and leaf diagram is similar to a histogram on its side.