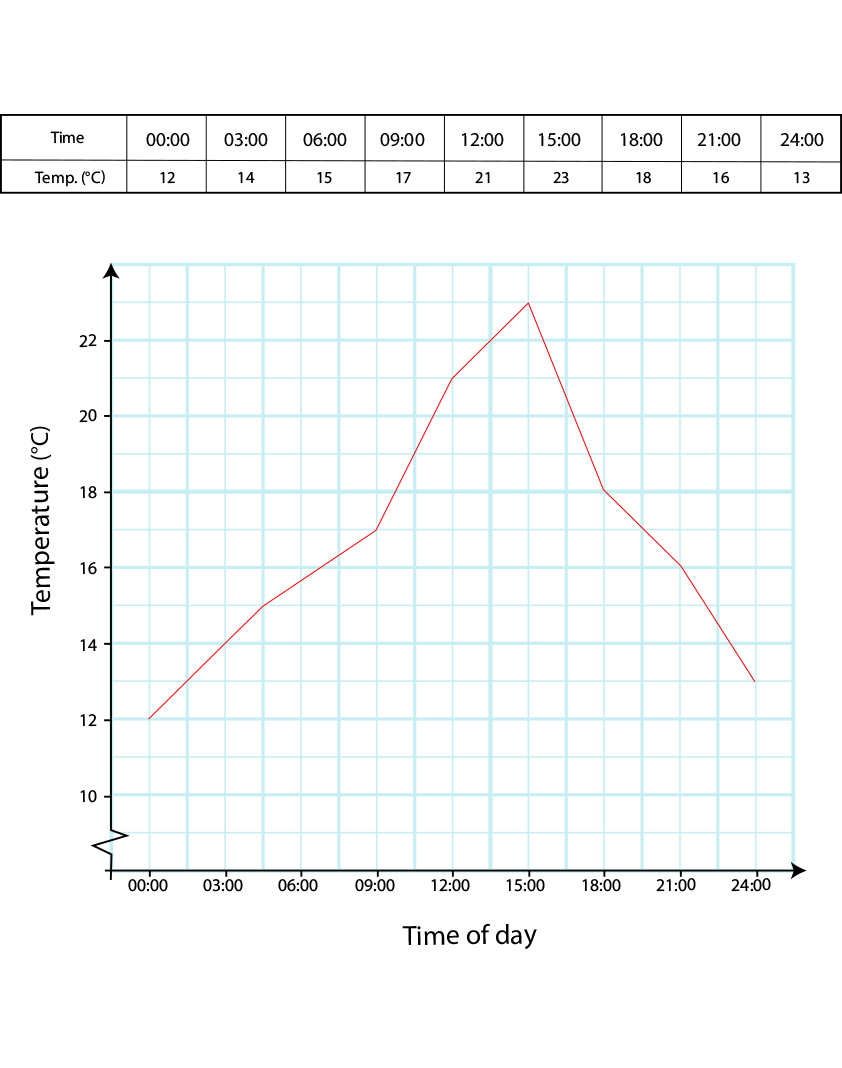
line graph
This type of graph is often used to show tendency/trend over time.
We plot a line graph as a series of points, and then draw a straight line to join each point. Both ends of the line graph don’t have to join the axes.
We can use the following as an example.
The table shows the temperature recorded at a weather station, every three hours, for a whole day.
The line graph opposite represents this data.

