
vertical line graph
A vertical line graph is a way of showing discrete data results from a frequency table.
We don’t use this type of graph for continuous data.
It is similar to a bar chart, but the bars aren’t as wide – they look like lines. The lengths of the lines show the frequency.
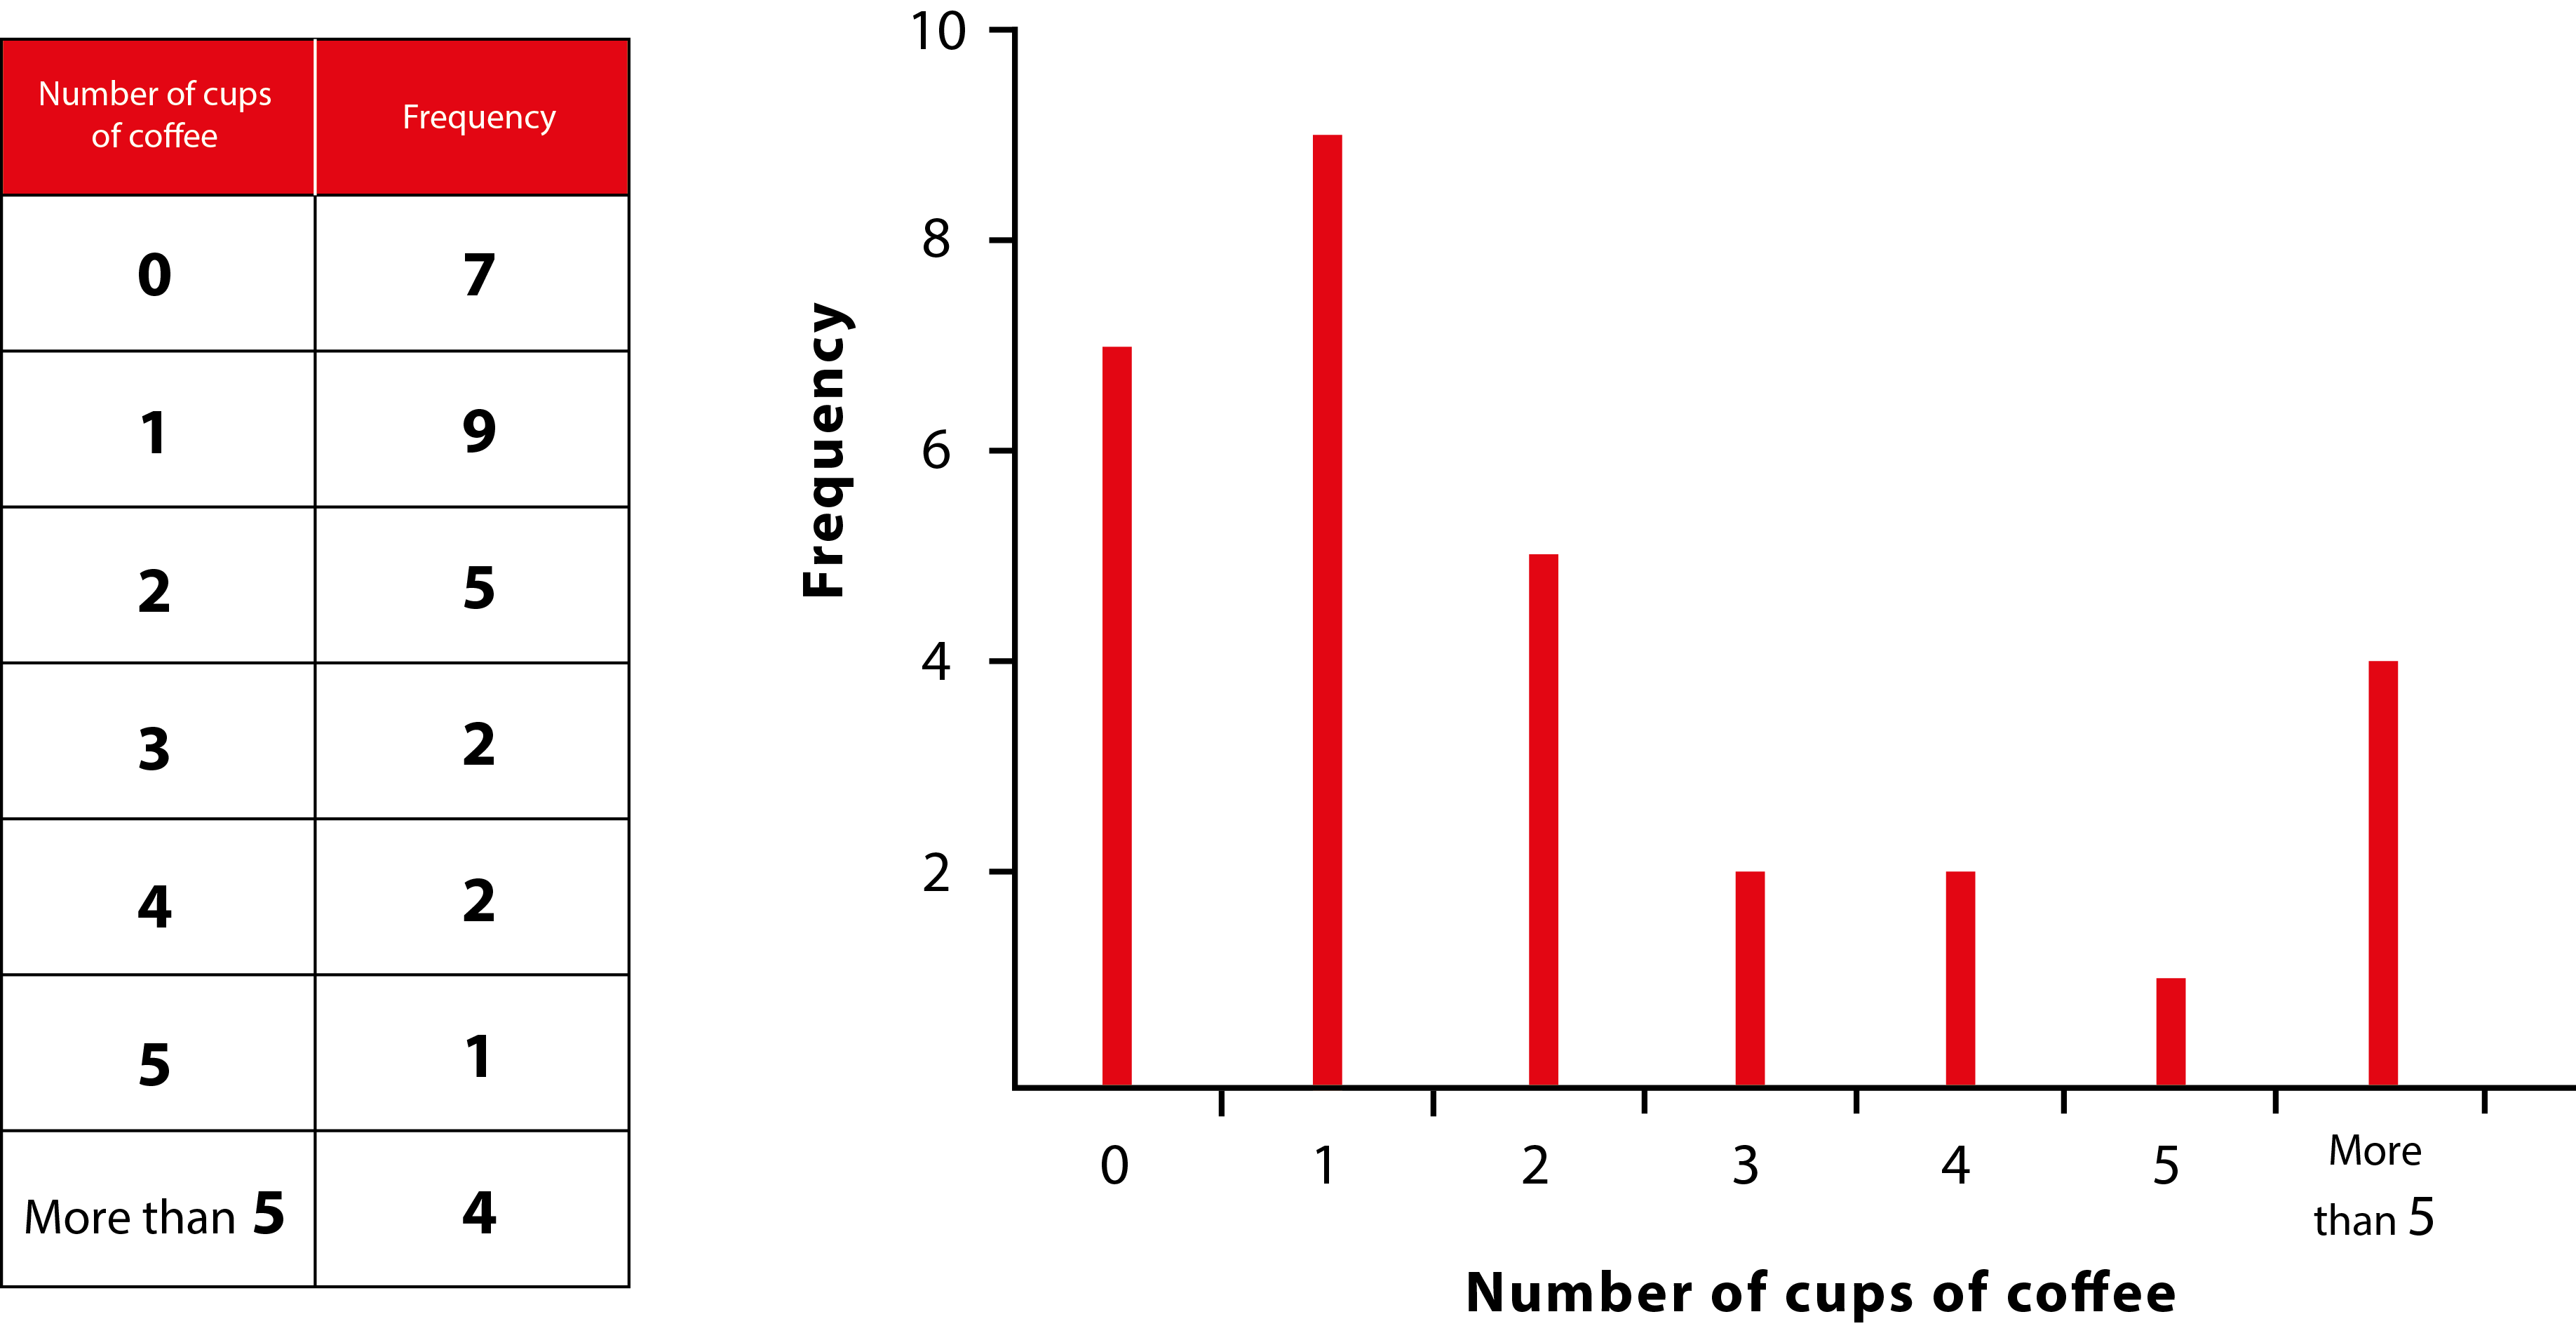
The table shows the number of cups of coffee a group of people drink each day.
We can use a vertical line graph to record the information.
We sometimes refer to a ‘vertical line graph’ as ‘bar line graph’.