
velocity-time graph
A velocity-time graph is a type of travel graph. It shows information about the velocity an object has travelled at and the time it has taken.
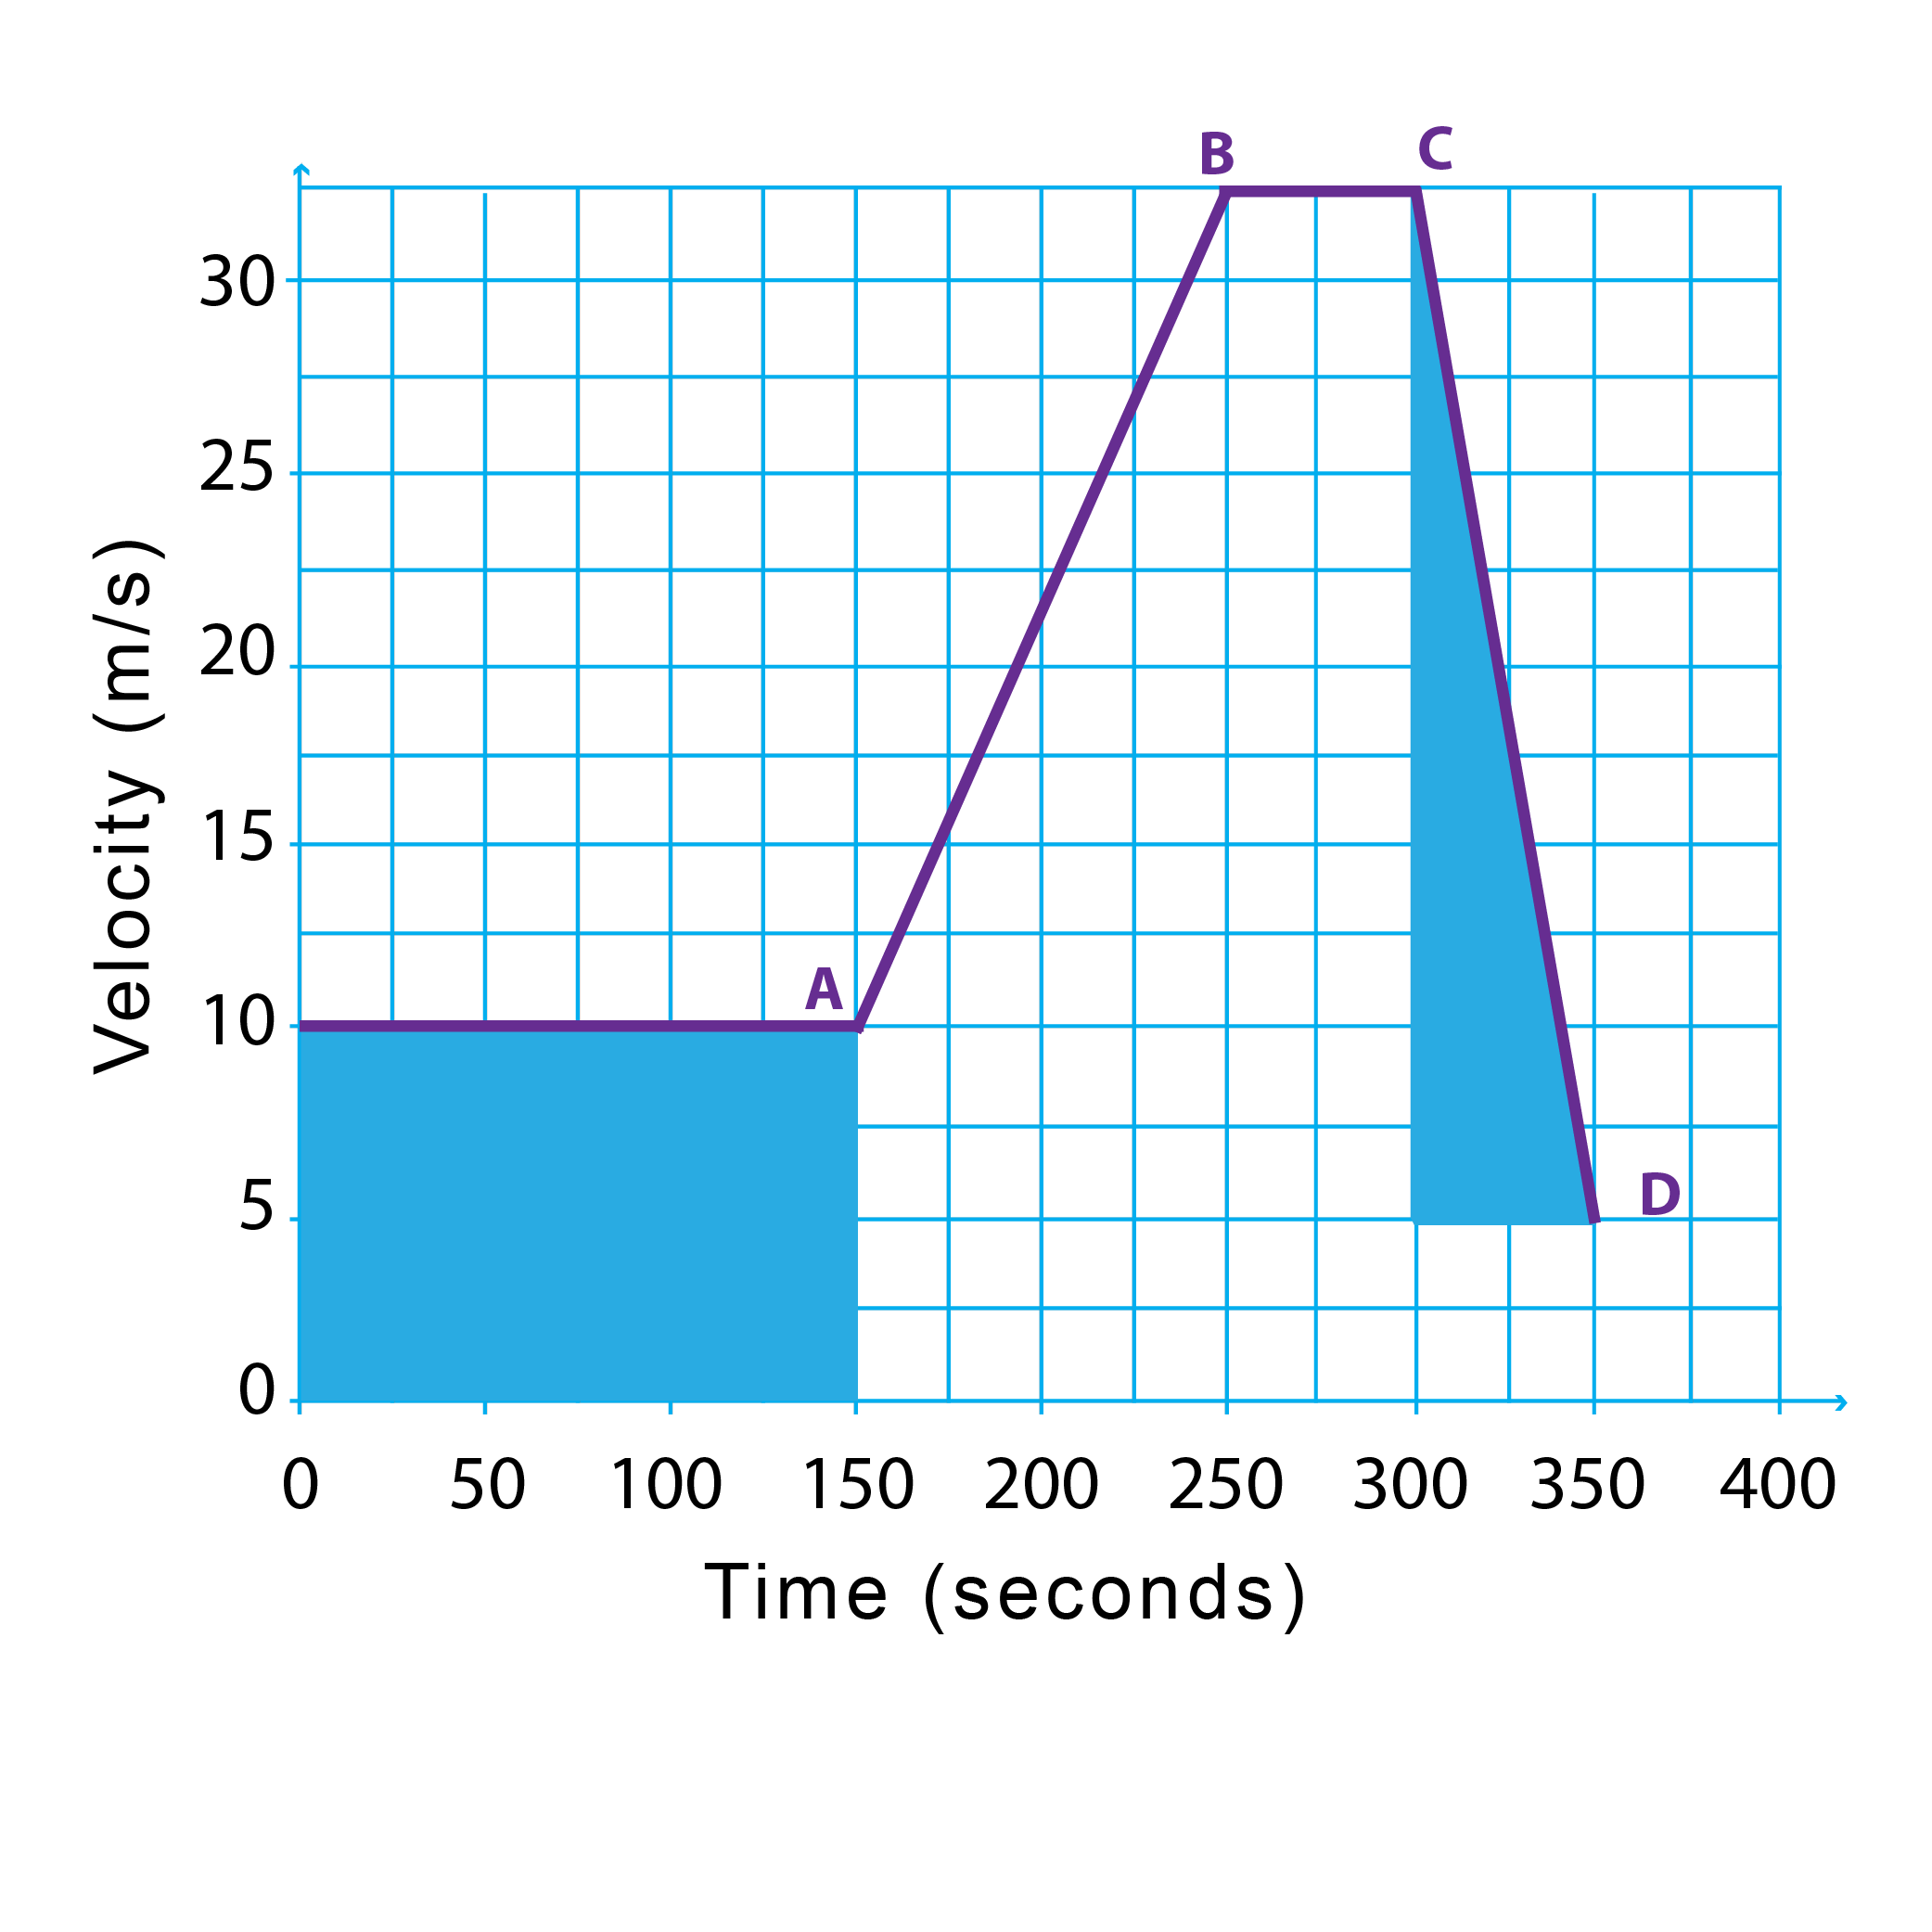
The velocity is plotted on the y-axis and the time is plotted on the x-axis.
The gradient of this type of graph at a specific time shows the acceleration at that time.
The area under a velocity-time graph shows the distance travelled in a specific period of time.