
correlation
This is the term used to describe the relationship between two variables in a set of data.
There are different types of correlation:
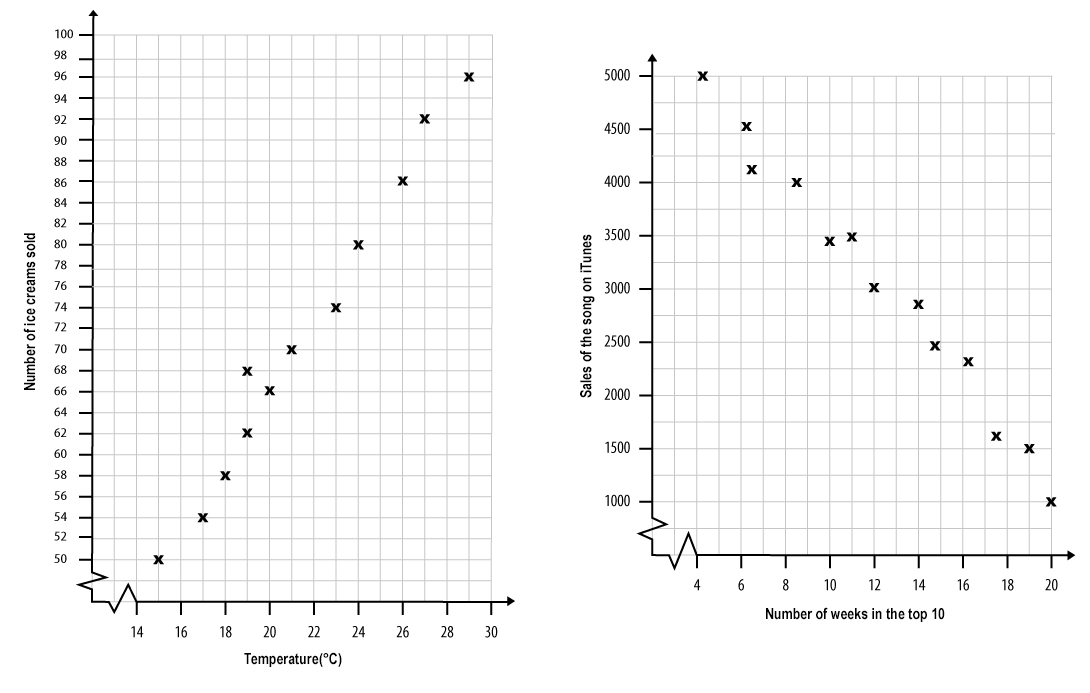
- Positive correlation which means as one quantity increases, the other quantity increases too. The first graph opposite is an example of this.As the temperature rises, we can see an increase in the number of ice creams sold.
- Negative correlation which means as one quantity increases, the other quantity decreases. The second graph opposite is an example of this.As the number of weeks increases, we can see a decrease in sales of the song on iTunes.
When the points on the graph are almost in a straight line, we say that the correlation is high or strong. There is a close relationship between the variables.
When the points on the graph are more scattered, we say that the correlation is low or weak. The relationship between the variables is not close.