
interquartile range
To find the interquartile range, we must first sort the data into ascending order. Let’s use the sets of data below as an example:
| Even set of data | 3, 4, 2, 8, 12, 6 |
| 2, 3, 4, 6, 8, 12 |
| Odd set of data | 4, 4, 3, 4, 7, 8, 10 |
| 3, 4, 4, 4, 7, 8, 10 |
We can then proceed to find the median.
In the even set of data, the median (mid-point) is between 4 and 6:
2, 3, 4,| 6, 8, 12
In the odd set of data, the median (mid-point) is 4:
3, 4, 4,4 7, 8, 10
We can now find the mid-points either side of the median.
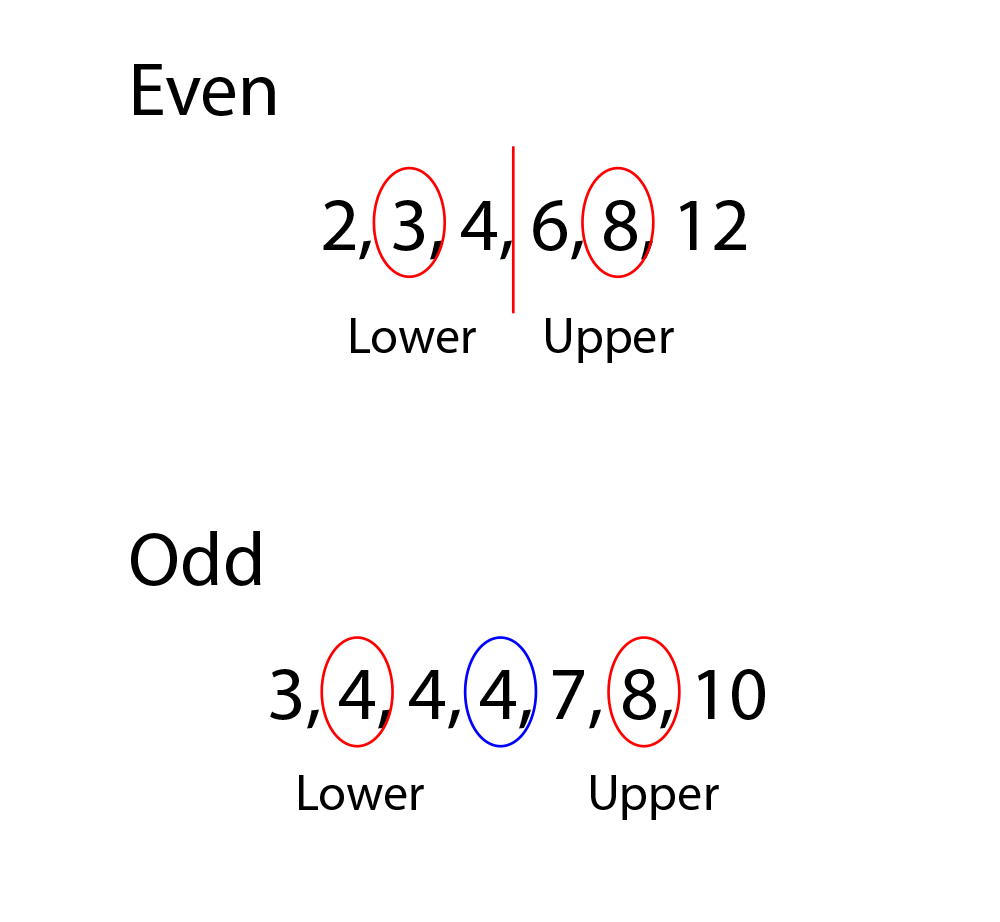
In the even set of data, the mid-points are between 3 and 8:
2,3, 4,| 6,8, 12
The lower quartile = 3
The upper quartile = 8
In the odd set of data, the mid-points are between 4 and 8:
3,4, 4,4 7,8,10
The lower quartile = 4
The upper quartile = 8
In order to find the interquartile range, we must subtract the lower quartile number from the upper quartile number:
Even data: 8 – 3 = 5
Odd data: 8 – 4 = 4