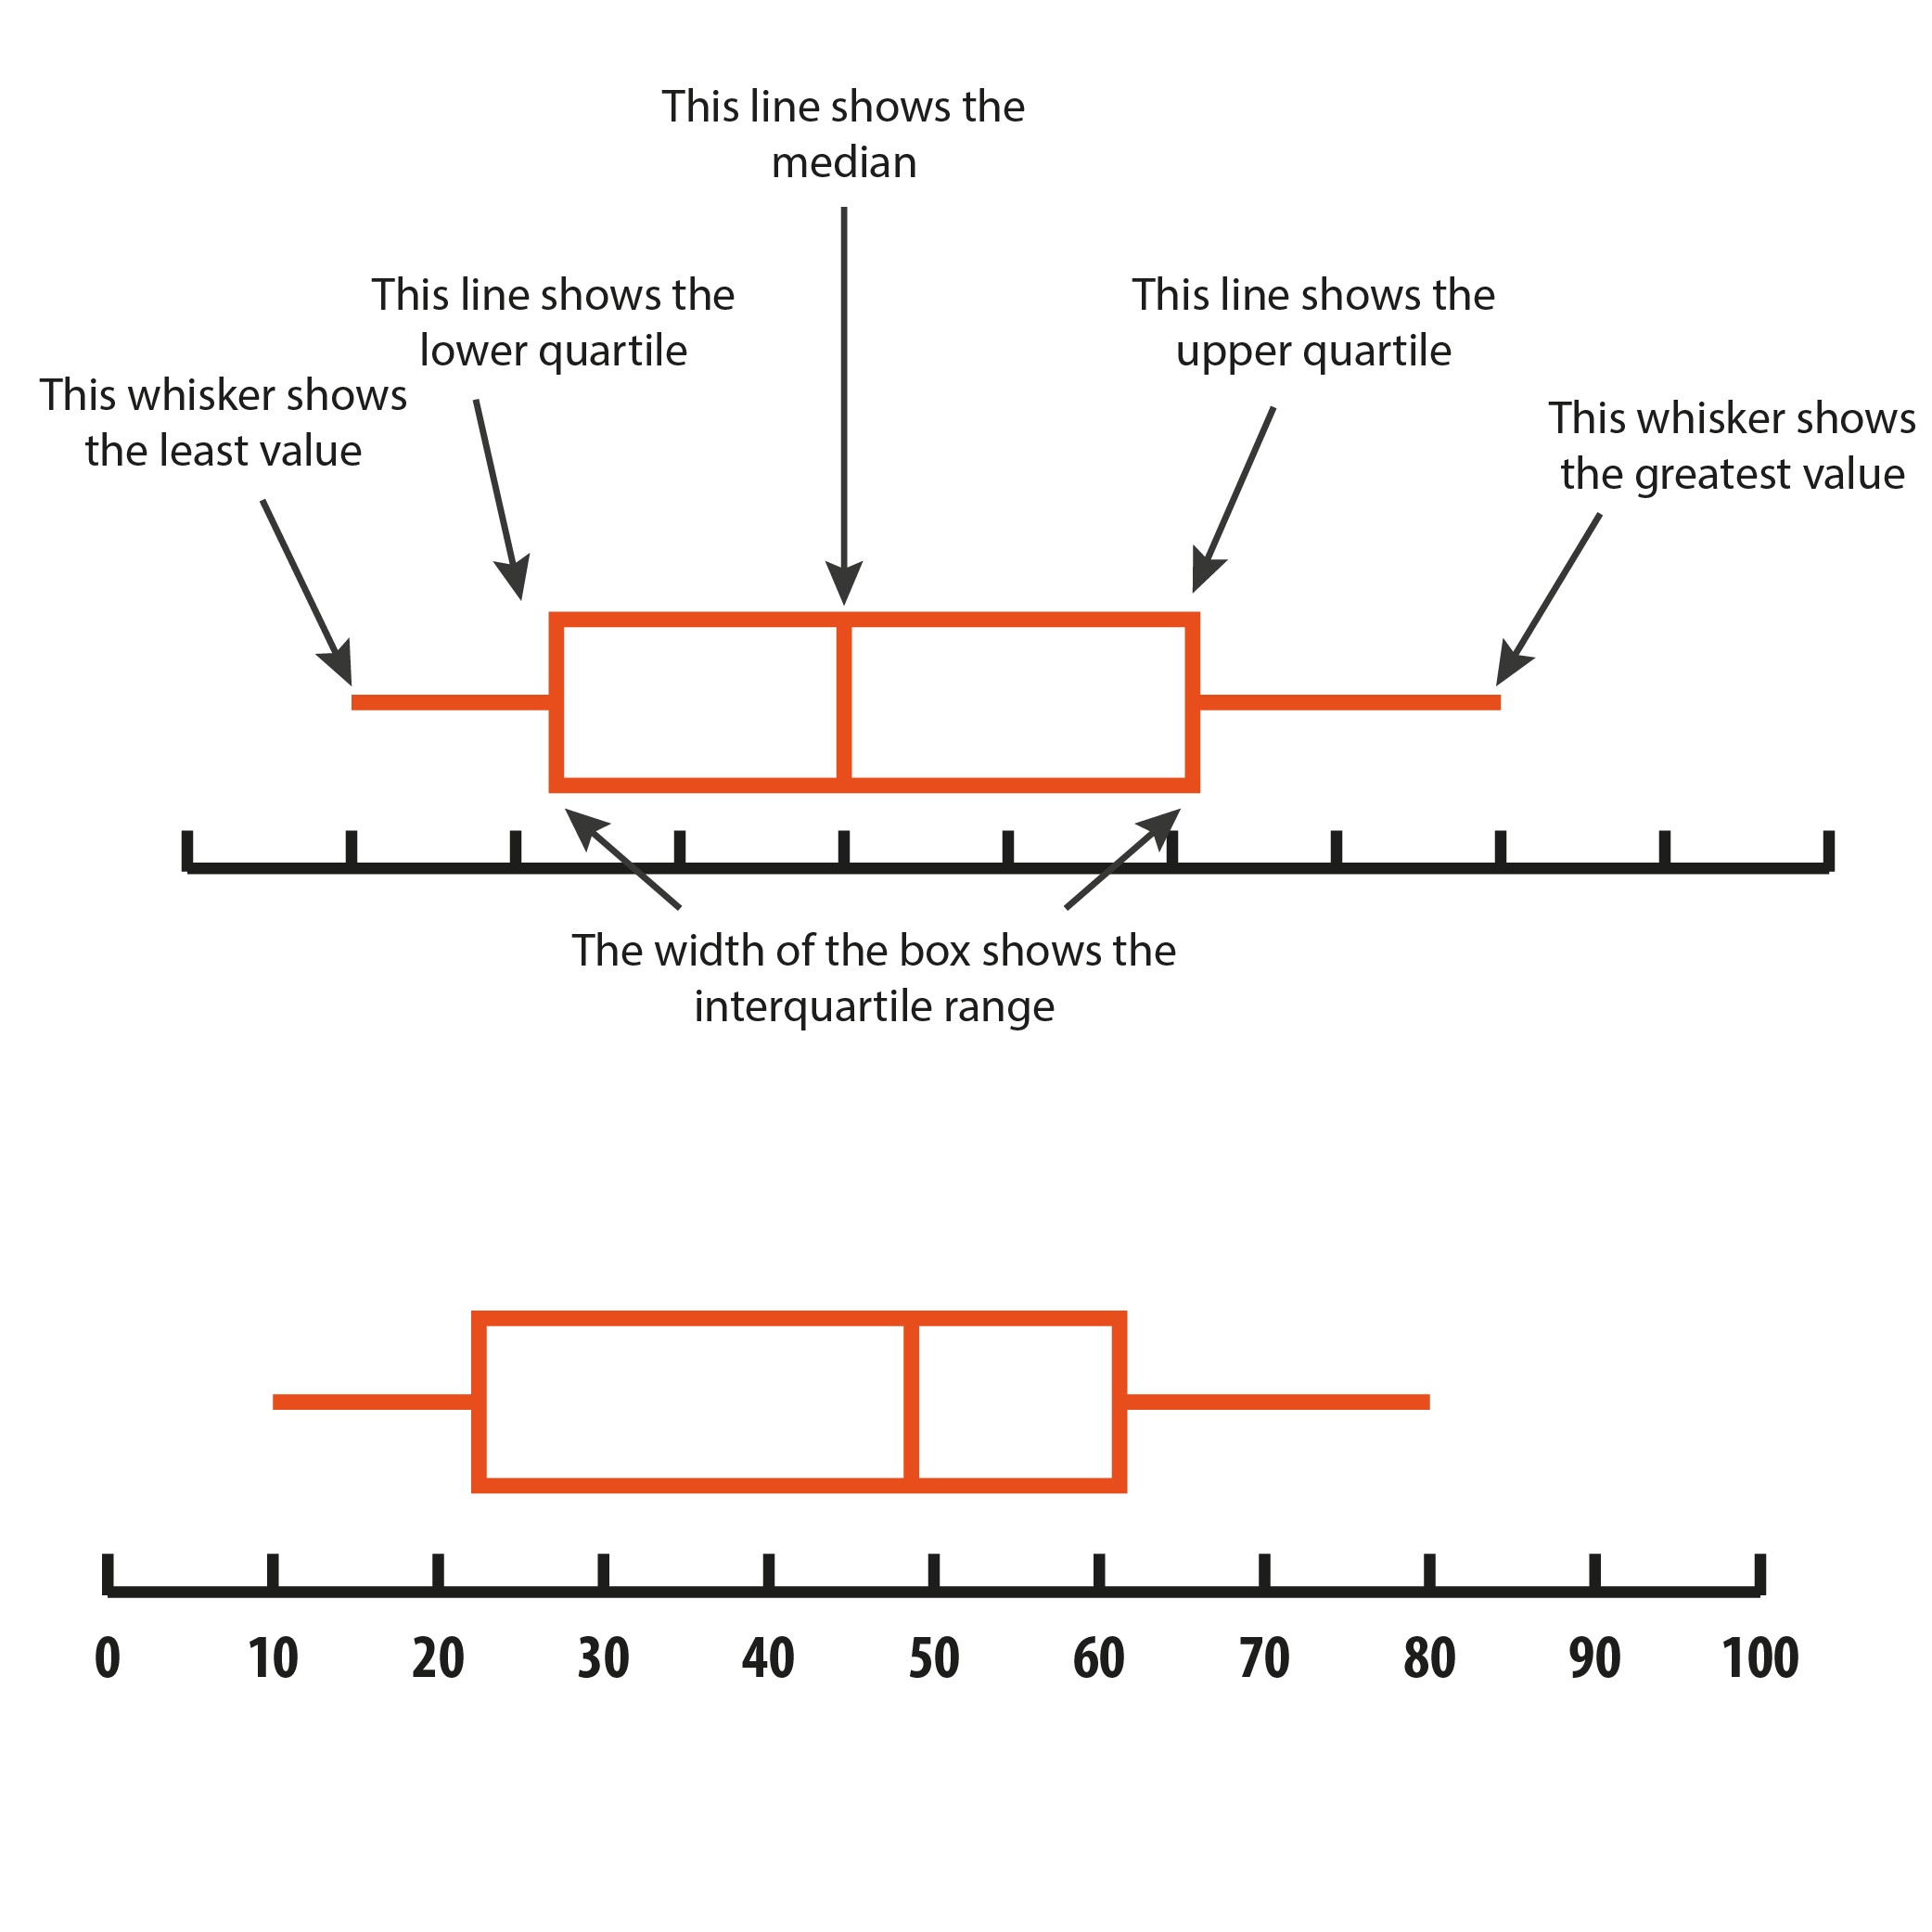
box and whisker diagram
A box and whisker diagram is used to represent a set of numerical data which is in order. It shows data distribution.
The horizontal lines, named ‘whiskers’, are either side of the box. They extend to the least value and the greatest value, and show the range of distribution.
This type of diagram is usually drawn with a number line as shown in the first diagram.
In the second diagram, the least value is 10, the greatest value is 80, the lower quartile is 22, the upper quartile is 61 and the median is 49.

