
frequency polygon
A frequency polygon is used to display grouped continuous data.
It’s formed by using straight lines to join the mid-point of the top of each bar in a frequency diagram.
The information below can be used as an example.
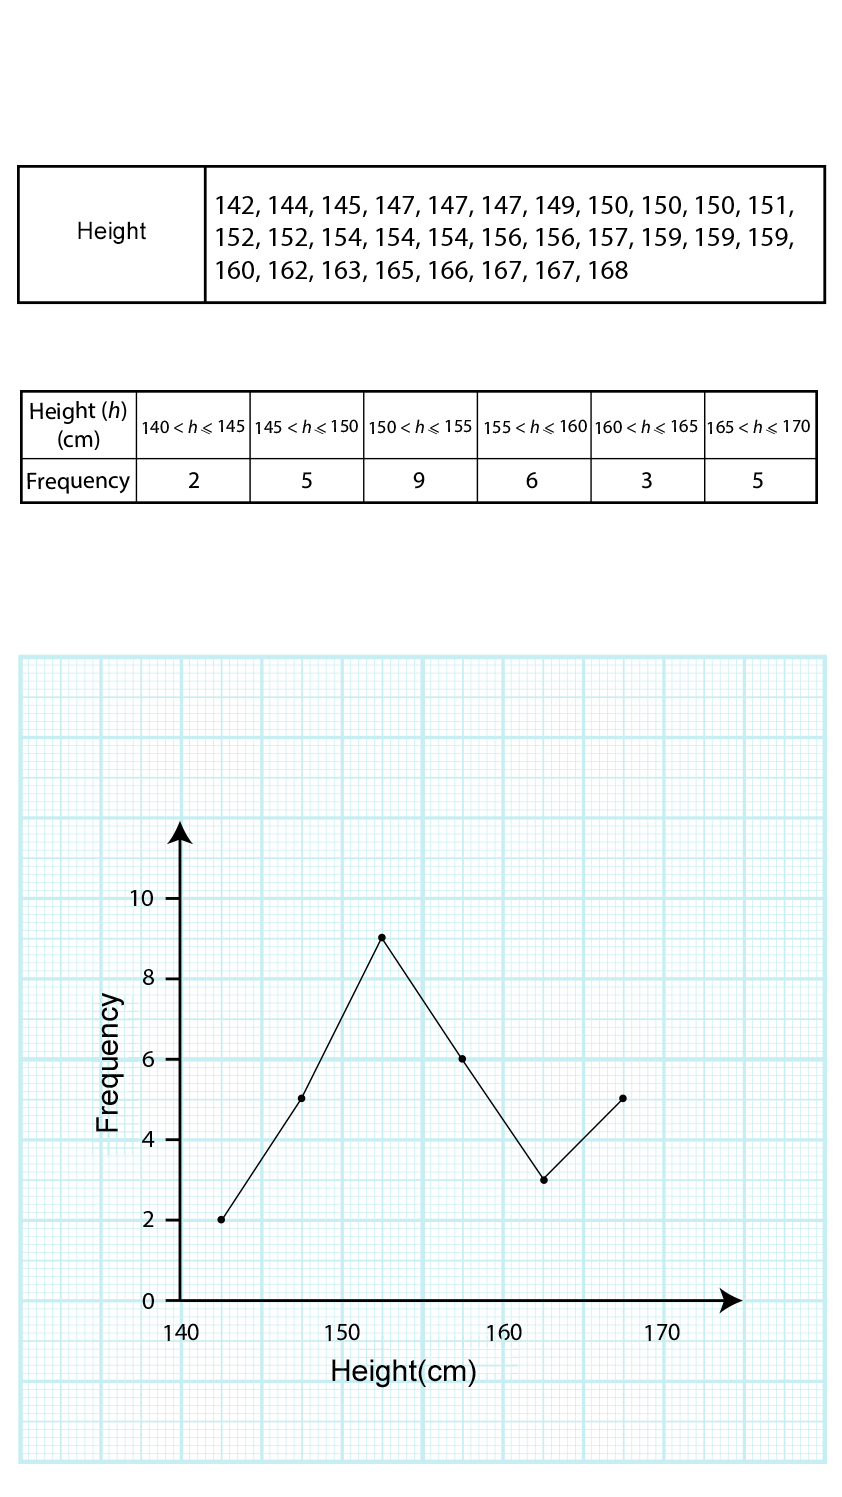
The height of 30 students in an English lesson were measured. We can see the results in the box opposite.
The data is grouped as is shown in the table.
To find the mid-point of each group, we add the bounds of each interval and divide the total by 2:


Then, we are able to use these points to form a frequency polygon.