
frequency density
In a histogram, the area of each bar represents frequency. This means that the frequency of groups of unequal widths are fairly represented.
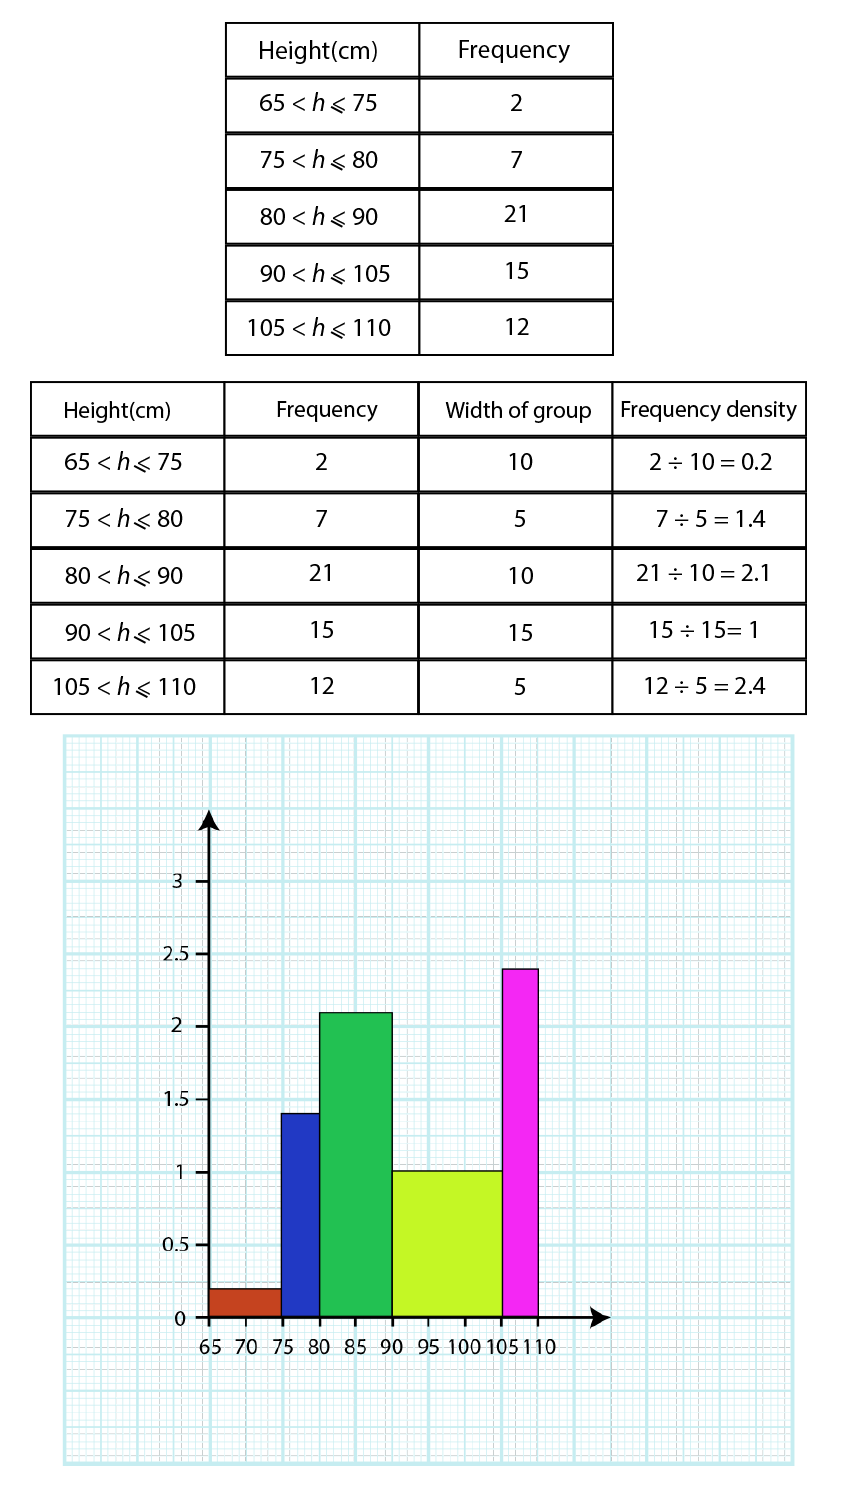
The first table shows the height of children in a class.
In order to record the information in the form of a histogram, we must first find the width of each group and the frequency density. We use the following formula to calculate the frequency density:

The second table shows the additional information and the results.
We can now draw the histogram.